![[Laravel] 디버그 바](/images/posts/index-laravel.jpg)
[Laravel] 디버그 바
나는 Docker등의 가상환경보다는 로컬 환경에서 직접 개발하는 것을 선호한다. 그러다 보니 Laravel도 Docker환경보다는 로컬에 직접 프로젝트를 생성하고 DBMS도 로컬에서 직접 구동시키는 과정을 시도해 보았다.
#01. Laravel Debugbar
Laravel Debugbar는 라라벨 프레임워크를 사용하여 어플리케이션을 구성할 때 Query, View, Event 등 개발자에게 도움이 되는 다양한 정보를 화면상에 표시해주는 패키지다.
라라벨 디버그바는 라라벨을 사용하여 개발할 때 필수 도구이다
https://github.com/barryvdh/laravel-debugbar
[1] Laravel Debugbar 설치
$ composer require barryvdh/laravel-debugbar
출력결과
./composer.json has been updated
Running composer update barryvdh/laravel-debugbar
Loading composer repositories with package information
Updating dependencies
Lock file operations: 2 installs, 0 updates, 0 removals
  - Locking barryvdh/laravel-debugbar (v3.13.5)
  - Locking maximebf/debugbar (v1.22.3)
Writing lock file
Installing dependencies from lock file (including require-dev)
Package operations: 2 installs, 0 updates, 0 removals
  - Downloading maximebf/debugbar (v1.22.3)
  - Downloading barryvdh/laravel-debugbar (v3.13.5)
  - Installing maximebf/debugbar (v1.22.3): Extracting archive
  - Installing barryvdh/laravel-debugbar (v3.13.5): Extracting archive
2 package suggestions were added by new dependencies, use `composer suggest` to see details.
Generating optimized autoload files
> Illuminate\Foundation\ComposerScripts::postAutoloadDump
> @php artisan package:discover --ansi

   INFO  Discovering packages.

  barryvdh/laravel-debugbar ........................................ DONE
  laravel/sail ..................................................... DONE
  laravel/tinker ................................................... DONE
  nesbot/carbon .................................................... DONE
  nunomaduro/collision ............................................. DONE
  nunomaduro/termwind .............................................. DONE
  pestphp/pest-plugin-laravel ...................................... DONE
  spatie/laravel-ignition .......................................... DONE

92 packages you are using are looking for funding.
Use the `composer fund` command to find out more!
> @php artisan vendor:publish --tag=laravel-assets --ansi --force

   INFO  No publishable resources for tag [laravel-assets].

No security vulnerability advisories found.
Using version ^3.13 for barryvdh/laravel-debugbar
[2] 설정값을 프로젝트로 복사
이후 프로젝트 디렉토리에서 터미널을 열고 아래 명령을 수행하면 기본 설정값이 프로젝트 내에 복사된다.
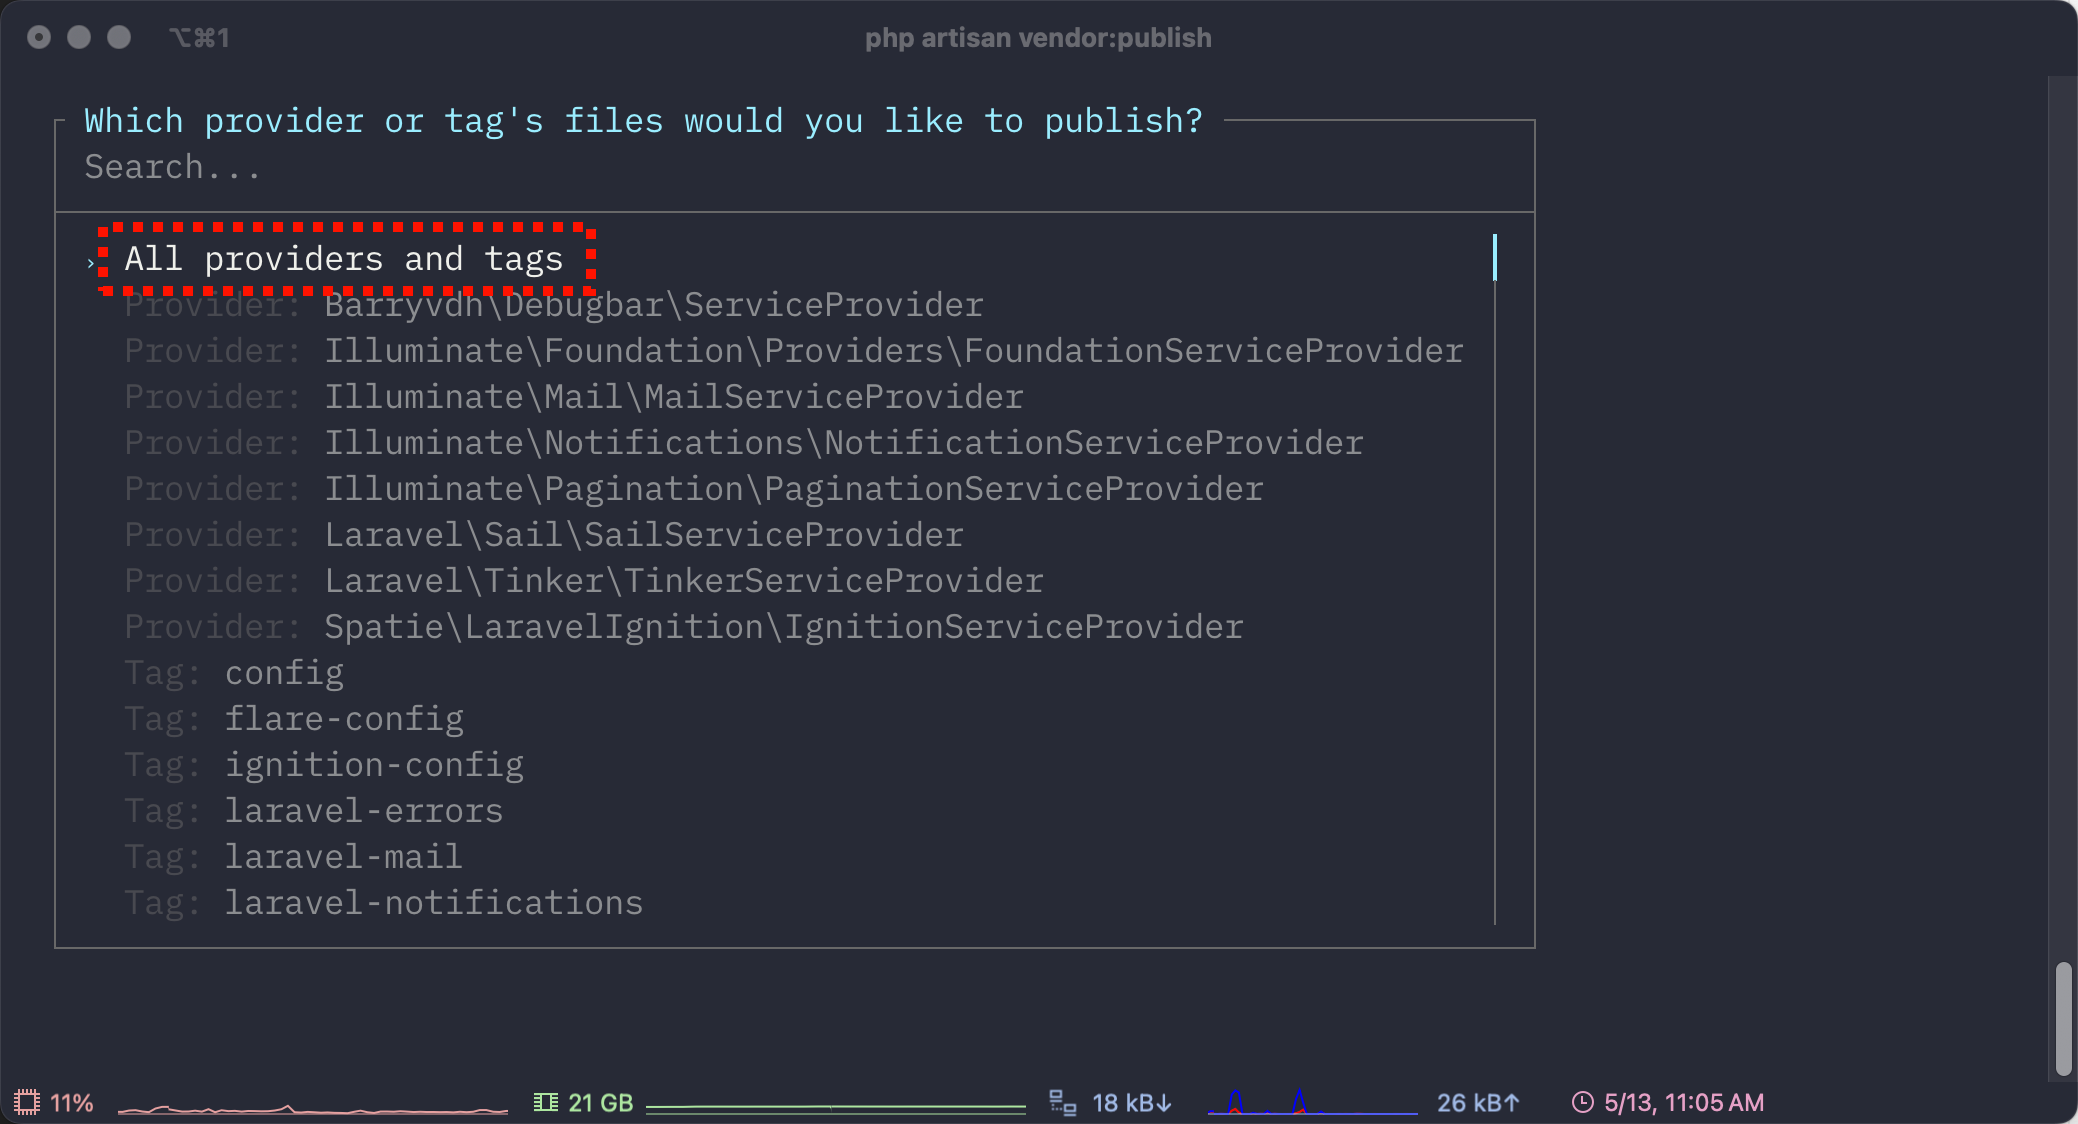
$ php artisan vendor:publish
이후 디버깅 프로바이더를 선택하는 화면이 나타나는데, 일단 All providers and tags를 선택하자.
#02. 디버그바 사용하기
[1] 브라우저를 통한 결과 확인
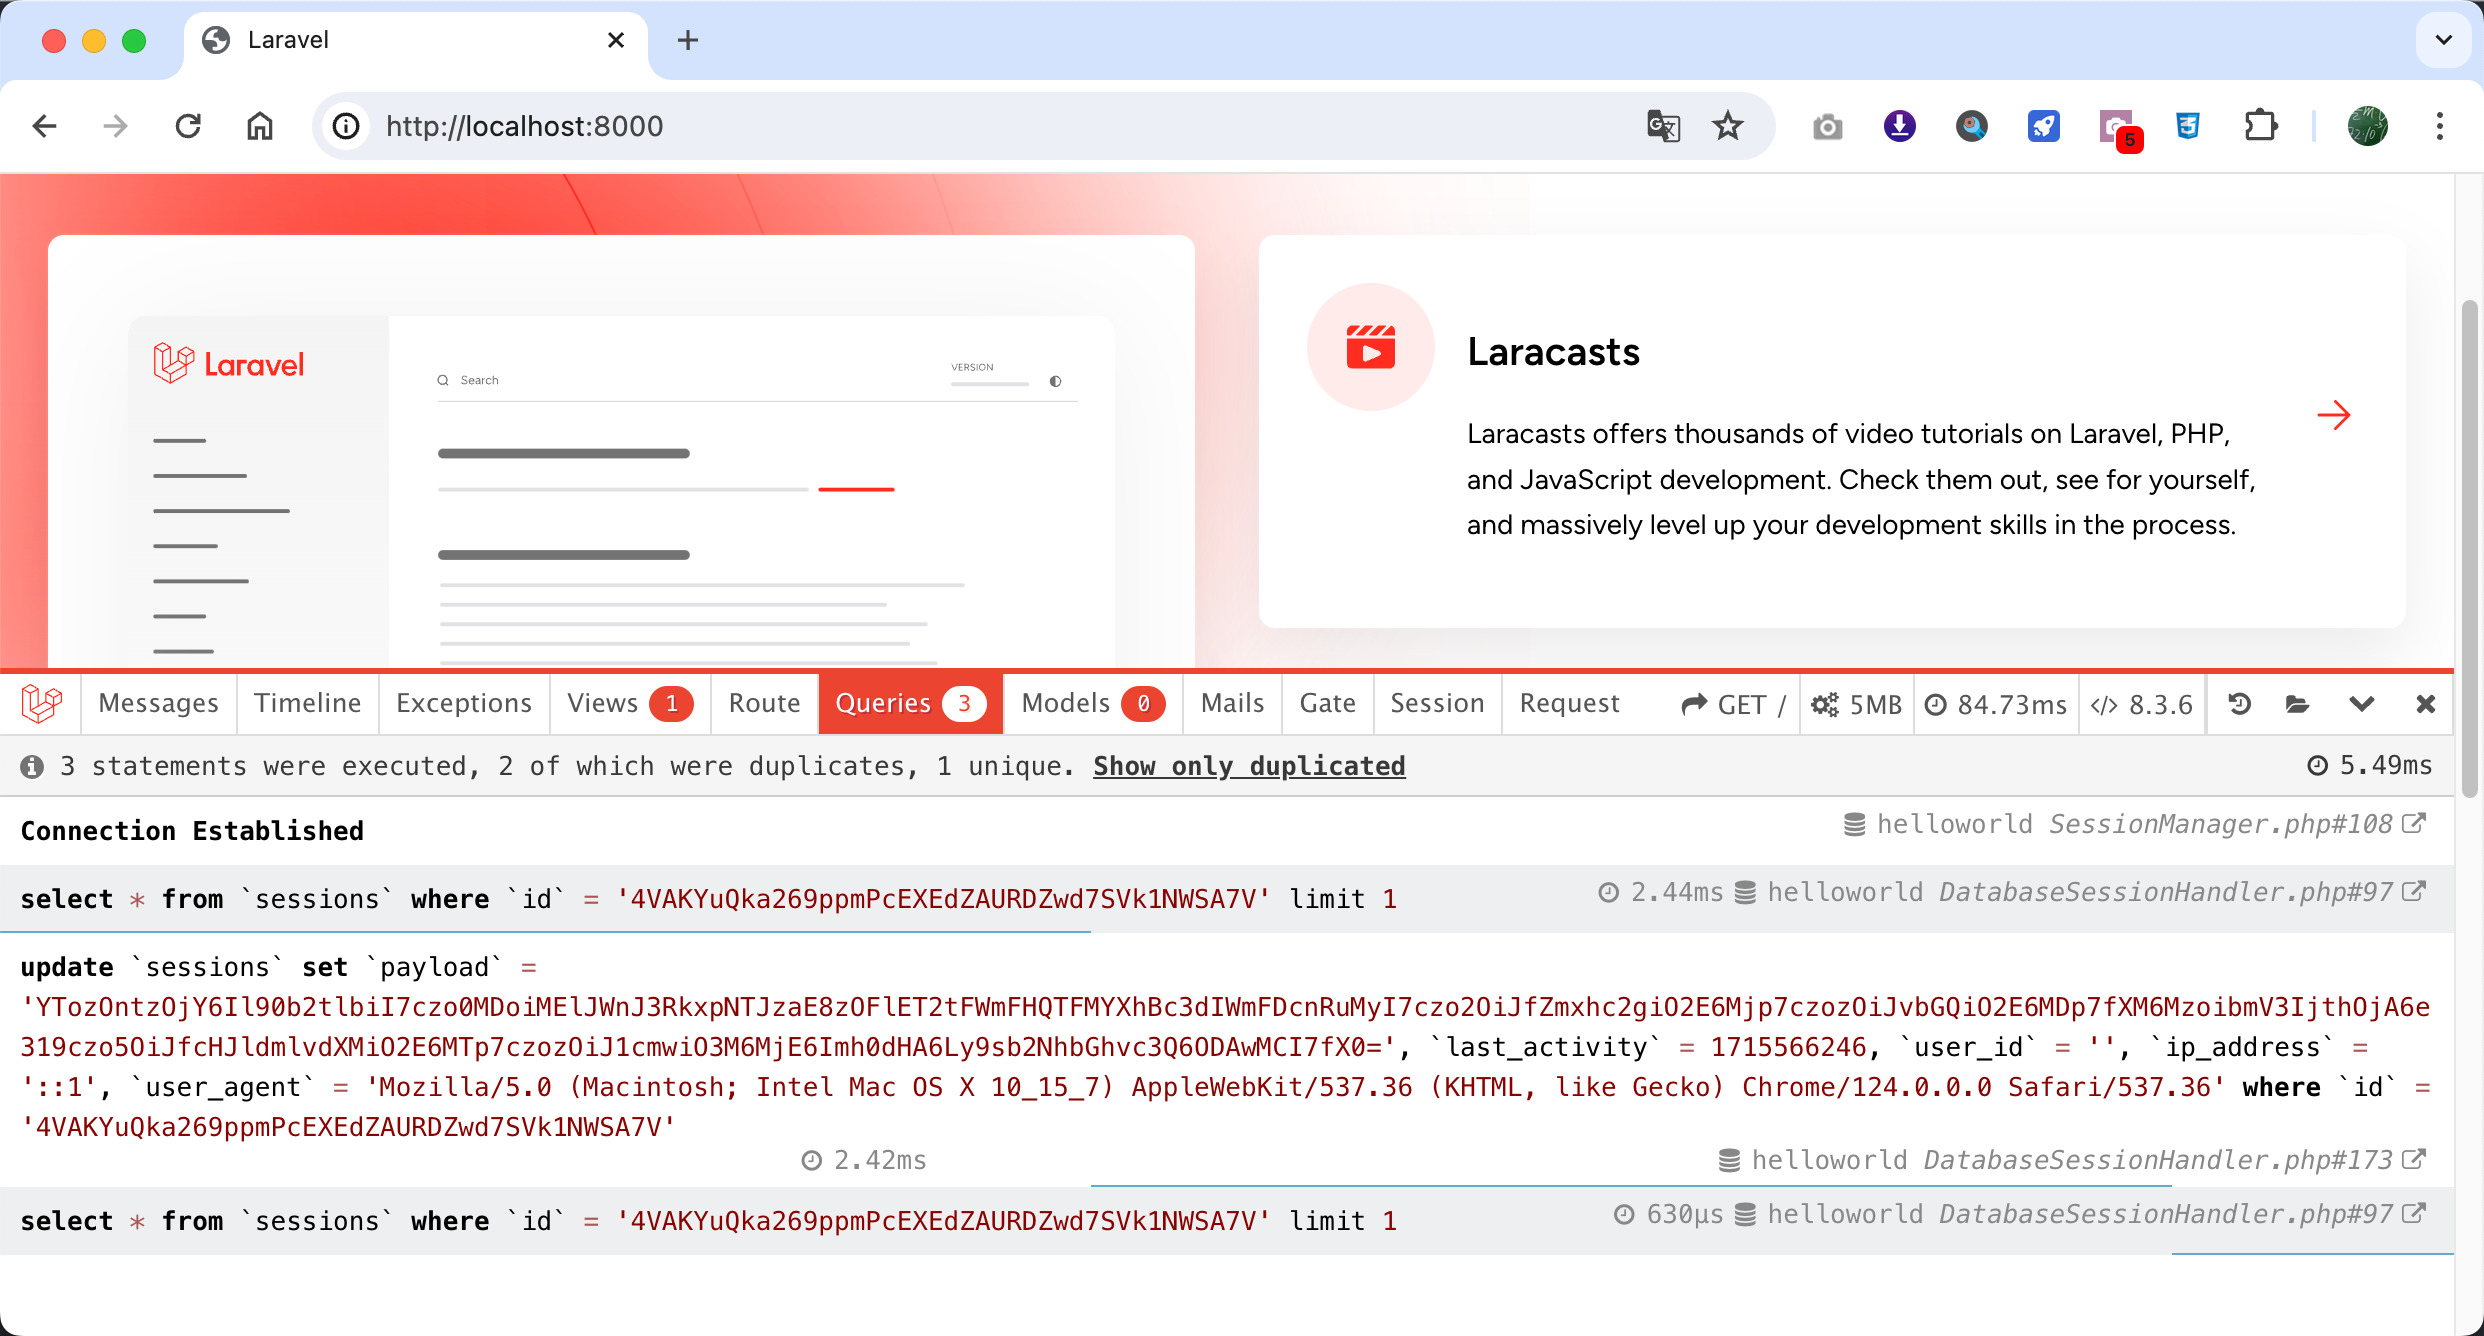
브라우저를 새로고침 하면 화면 하단에 디버그바가 표시된다.
(서버를 재가동할 필요는 없다.)
[2] 디버그 ON/OFF
/.env 파일에서 APP_DEBUG값을 false로 변경하면 디버그바가 더 이상 표시되지 않는다. (쩐다…)
[3] 디버그 메시지 사용
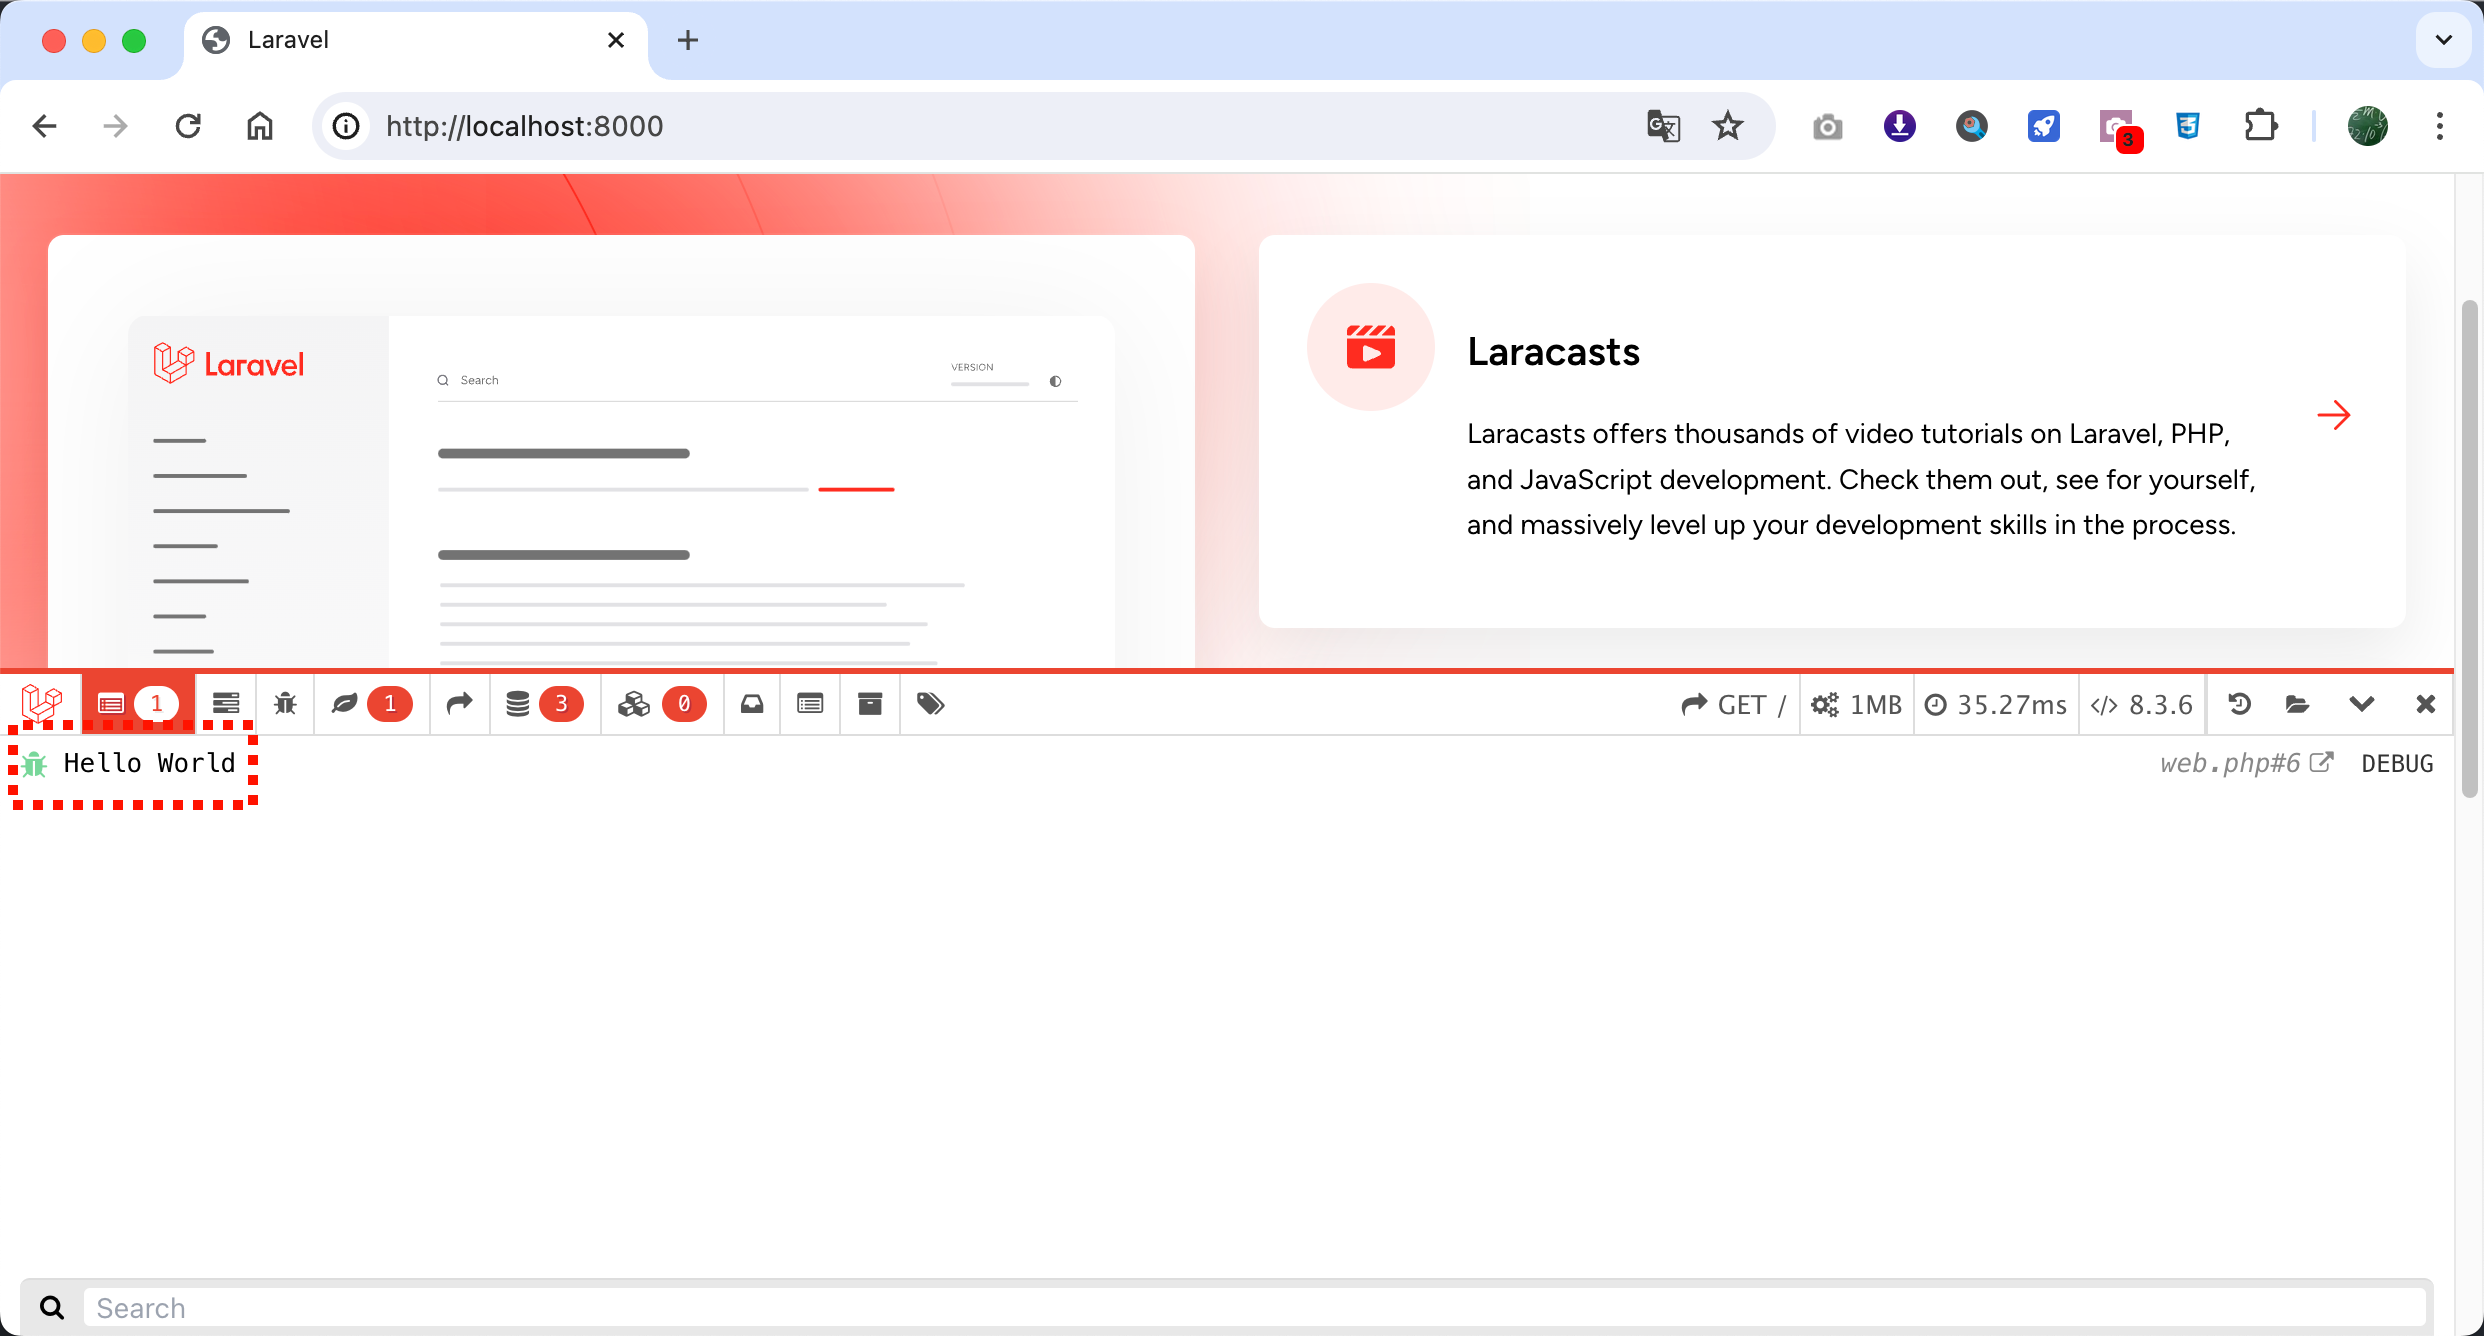
Debugbar::info(), Debugbar::error() 같이 로그 레벨에 따라 파사드를 호출할 수도 있지만, 가장 많이 사용하게 될 함수는 단순하게 값을 덤프할 수 있는 debug()함수이다.
debug("Hello World");
/routes/web.php파일을 열어보면 기본적으로 작성되어 있는 코드가 있다. 이 코드의 Route::get()함수 내부에 디버그 메시지를 출력하는 코드를 삽입해 보았다.
<?php

use Illuminate\Support\Facades\Route;

Route::get('/', function () {
    debug("Hello World");       // <-- 테스트 코드
    return view('welcome');
});
브라우저로 결과를 확인하면 아래와 같이 메시지가 표시된다.
[3] 설정파일 확인
이후 아래와 같이 기본 설정 내용들이 셋팅된 /config/debugbar.php 파일이 생성된다.
주요하게 살펴볼 만한 옵션은 딱히 없지만 직접 설정 파일을 열어보고 어떤 옵션들이 있는지 살펴보자.
공부하는 동안은 기본설정을 그대로 사용하자.
<?php

return [

    /*
     |--------------------------------------------------------------------------
     | Debugbar Settings
     |--------------------------------------------------------------------------
     |
     | Debugbar is enabled by default, when debug is set to true in app.php.
     | You can override the value by setting enable to true or false instead of null.
     |
     | You can provide an array of URI's that must be ignored (eg. 'api/*')
     |
     */

    'enabled' => env('DEBUGBAR_ENABLED', null),
    'except' => [
        'telescope*',
        'horizon*',
    ],

    /*
     |--------------------------------------------------------------------------
     | Storage settings
     |--------------------------------------------------------------------------
     |
     | DebugBar stores data for session/ajax requests.
     | You can disable this, so the debugbar stores data in headers/session,
     | but this can cause problems with large data collectors.
     | By default, file storage (in the storage folder) is used. Redis and PDO
     | can also be used. For PDO, run the package migrations first.
     |
     | Warning: Enabling storage.open will allow everyone to access previous
     | request, do not enable open storage in publicly available environments!
     | Specify a callback if you want to limit based on IP or authentication.
     | Leaving it to null will allow localhost only.
     */
    'storage' => [
        'enabled'    => true,
        'open'       => env('DEBUGBAR_OPEN_STORAGE'), // bool/callback.
        'driver'     => 'file', // redis, file, pdo, socket, custom
        'path'       => storage_path('debugbar'), // For file driver
        'connection' => null,   // Leave null for default connection (Redis/PDO)
        'provider'   => '', // Instance of StorageInterface for custom driver
        'hostname'   => '127.0.0.1', // Hostname to use with the "socket" driver
        'port'       => 2304, // Port to use with the "socket" driver
    ],

    /*
    |--------------------------------------------------------------------------
    | Editor
    |--------------------------------------------------------------------------
    |
    | Choose your preferred editor to use when clicking file name.
    |
    | Supported: "phpstorm", "vscode", "vscode-insiders", "vscode-remote",
    |            "vscode-insiders-remote", "vscodium", "textmate", "emacs",
    |            "sublime", "atom", "nova", "macvim", "idea", "netbeans",
    |            "xdebug", "espresso"
    |
    */

    'editor' => env('DEBUGBAR_EDITOR') ?: env('IGNITION_EDITOR', 'phpstorm'),

    /*
    |--------------------------------------------------------------------------
    | Remote Path Mapping
    |--------------------------------------------------------------------------
    |
    | If you are using a remote dev server, like Laravel Homestead, Docker, or
    | even a remote VPS, it will be necessary to specify your path mapping.
    |
    | Leaving one, or both of these, empty or null will not trigger the remote
    | URL changes and Debugbar will treat your editor links as local files.
    |
    | "remote_sites_path" is an absolute base path for your sites or projects
    | in Homestead, Vagrant, Docker, or another remote development server.
    |
    | Example value: "/home/vagrant/Code"
    |
    | "local_sites_path" is an absolute base path for your sites or projects
    | on your local computer where your IDE or code editor is running on.
    |
    | Example values: "/Users/<name>/Code", "C:\Users\<name>\Documents\Code"
    |
    */

    'remote_sites_path' => env('DEBUGBAR_REMOTE_SITES_PATH'),
    'local_sites_path' => env('DEBUGBAR_LOCAL_SITES_PATH', env('IGNITION_LOCAL_SITES_PATH')),

    /*
     |--------------------------------------------------------------------------
     | Vendors
     |--------------------------------------------------------------------------
     |
     | Vendor files are included by default, but can be set to false.
     | This can also be set to 'js' or 'css', to only include javascript or css vendor files.
     | Vendor files are for css: font-awesome (including fonts) and highlight.js (css files)
     | and for js: jquery and highlight.js
     | So if you want syntax highlighting, set it to true.
     | jQuery is set to not conflict with existing jQuery scripts.
     |
     */

    'include_vendors' => true,

    /*
     |--------------------------------------------------------------------------
     | Capture Ajax Requests
     |--------------------------------------------------------------------------
     |
     | The Debugbar can capture Ajax requests and display them. If you don't want this (ie. because of errors),
     | you can use this option to disable sending the data through the headers.
     |
     | Optionally, you can also send ServerTiming headers on ajax requests for the Chrome DevTools.
     |
     | Note for your request to be identified as ajax requests they must either send the header
     | X-Requested-With with the value XMLHttpRequest (most JS libraries send this), or have application/json as a Accept header.
     |
     | By default `ajax_handler_auto_show` is set to true allowing ajax requests to be shown automatically in the Debugbar.
     | Changing `ajax_handler_auto_show` to false will prevent the Debugbar from reloading.
     */

    'capture_ajax' => true,
    'add_ajax_timing' => false,
    'ajax_handler_auto_show' => true,
    'ajax_handler_enable_tab' => true,

    /*
     |--------------------------------------------------------------------------
     | Custom Error Handler for Deprecated warnings
     |--------------------------------------------------------------------------
     |
     | When enabled, the Debugbar shows deprecated warnings for Symfony components
     | in the Messages tab.
     |
     */
    'error_handler' => false,

    /*
     |--------------------------------------------------------------------------
     | Clockwork integration
     |--------------------------------------------------------------------------
     |
     | The Debugbar can emulate the Clockwork headers, so you can use the Chrome
     | Extension, without the server-side code. It uses Debugbar collectors instead.
     |
     */
    'clockwork' => false,

    /*
     |--------------------------------------------------------------------------
     | DataCollectors
     |--------------------------------------------------------------------------
     |
     | Enable/disable DataCollectors
     |
     */

    'collectors' => [
        'phpinfo'         => true,  // Php version
        'messages'        => true,  // Messages
        'time'            => true,  // Time Datalogger
        'memory'          => true,  // Memory usage
        'exceptions'      => true,  // Exception displayer
        'log'             => true,  // Logs from Monolog (merged in messages if enabled)
        'db'              => true,  // Show database (PDO) queries and bindings
        'views'           => true,  // Views with their data
        'route'           => true,  // Current route information
        'auth'            => false, // Display Laravel authentication status
        'gate'            => true,  // Display Laravel Gate checks
        'session'         => true,  // Display session data
        'symfony_request' => true,  // Only one can be enabled..
        'mail'            => true,  // Catch mail messages
        'laravel'         => false, // Laravel version and environment
        'events'          => false, // All events fired
        'default_request' => false, // Regular or special Symfony request logger
        'logs'            => false, // Add the latest log messages
        'files'           => false, // Show the included files
        'config'          => false, // Display config settings
        'cache'           => false, // Display cache events
        'models'          => true,  // Display models
        'livewire'        => true,  // Display Livewire (when available)
        'jobs'            => false, // Display dispatched jobs
    ],

    /*
     |--------------------------------------------------------------------------
     | Extra options
     |--------------------------------------------------------------------------
     |
     | Configure some DataCollectors
     |
     */

    'options' => [
        'time' => [
            'memory_usage' => false,  // Calculated by subtracting memory start and end, it may be inaccurate
        ],
        'messages' => [
            'trace' => true,   // Trace the origin of the debug message
        ],
        'memory' => [
            'reset_peak' => false,     // run memory_reset_peak_usage before collecting
            'with_baseline' => false,  // Set boot memory usage as memory peak baseline
            'precision' => 0,          // Memory rounding precision
        ],
        'auth' => [
            'show_name' => true,   // Also show the users name/email in the debugbar
            'show_guards' => true, // Show the guards that are used
        ],
        'db' => [
            'with_params'       => true,   // Render SQL with the parameters substituted
            'backtrace'         => true,   // Use a backtrace to find the origin of the query in your files.
            'backtrace_exclude_paths' => [],   // Paths to exclude from backtrace. (in addition to defaults)
            'timeline'          => false,  // Add the queries to the timeline
            'duration_background'  => true,   // Show shaded background on each query relative to how long it took to execute.
            'explain' => [                 // Show EXPLAIN output on queries
                'enabled' => false,
                'types' => ['SELECT'],     // Deprecated setting, is always only SELECT
            ],
            'hints'             => false,    // Show hints for common mistakes
            'show_copy'         => false,    // Show copy button next to the query,
            'slow_threshold'    => false,   // Only track queries that last longer than this time in ms
            'memory_usage'      => false,   // Show queries memory usage
            'soft_limit'       => 100,      // After the soft limit, no parameters/backtrace are captured
            'hard_limit'       => 500,      // After the hard limit, queries are ignored
        ],
        'mail' => [
            'timeline' => false,  // Add mails to the timeline
            'show_body' => true,
        ],
        'views' => [
            'timeline' => false,    // Add the views to the timeline (Experimental)
            'data' => false,        //true for all data, 'keys' for only names, false for no parameters.
            'group' => 50,          // Group duplicate views. Pass value to auto-group, or true/false to force
            'exclude_paths' => [    // Add the paths which you don't want to appear in the views
                'vendor/filament'   // Exclude Filament components by default
            ],
        ],
        'route' => [
            'label' => true,  // show complete route on bar
        ],
        'session' => [
            'hiddens' => [], // hides sensitive values using array paths
        ],
        'symfony_request' => [
            'hiddens' => [], // hides sensitive values using array paths, example: request_request.password
        ],
        'events' => [
            'data' => false, // collect events data, listeners
        ],
        'logs' => [
            'file' => null,
        ],
        'cache' => [
            'values' => true, // collect cache values
        ],
    ],

    /*
     |--------------------------------------------------------------------------
     | Inject Debugbar in Response
     |--------------------------------------------------------------------------
     |
     | Usually, the debugbar is added just before </body>, by listening to the
     | Response after the App is done. If you disable this, you have to add them
     | in your template yourself. See http://phpdebugbar.com/docs/rendering.html
     |
     */

    'inject' => true,

    /*
     |--------------------------------------------------------------------------
     | DebugBar route prefix
     |--------------------------------------------------------------------------
     |
     | Sometimes you want to set route prefix to be used by DebugBar to load
     | its resources from. Usually the need comes from misconfigured web server or
     | from trying to overcome bugs like this: http://trac.nginx.org/nginx/ticket/97
     |
     */
    'route_prefix' => '_debugbar',

    /*
     |--------------------------------------------------------------------------
     | DebugBar route middleware
     |--------------------------------------------------------------------------
     |
     | Additional middleware to run on the Debugbar routes
     */
    'route_middleware' => [],

    /*
     |--------------------------------------------------------------------------
     | DebugBar route domain
     |--------------------------------------------------------------------------
     |
     | By default DebugBar route served from the same domain that request served.
     | To override default domain, specify it as a non-empty value.
     */
    'route_domain' => null,

    /*
     |--------------------------------------------------------------------------
     | DebugBar theme
     |--------------------------------------------------------------------------
     |
     | Switches between light and dark theme. If set to auto it will respect system preferences
     | Possible values: auto, light, dark
     */
    'theme' => env('DEBUGBAR_THEME', 'auto'),

    /*
     |--------------------------------------------------------------------------
     | Backtrace stack limit
     |--------------------------------------------------------------------------
     |
     | By default, the DebugBar limits the number of frames returned by the 'debug_backtrace()' function.
     | If you need larger stacktraces, you can increase this number. Setting it to 0 will result in no limit.
     */
    'debug_backtrace_limit' => 50,
];